Managing Monitors
You can create a monitor that contains the specific information you need, displayed in a chosen format.
Once the monitor has been created, you can update the settings to change the type of information it displays, as well as filters, grouping and format of the display. You can also delete a monitor if it is no longer relevant. Remember, only you can access the monitors you create. Analysts cannot share monitors.
Creating a Monitor
A wizard takes you through the steps needed to create your monitor. You can switch between any of the steps using the explorer to the left of the window. However, it is recommended you follow through the steps in the order in which the options are displayed.
Before you start
You must have Monitor selected in the Options tab of your IPK Management security role to create a monitor for Incident and Problem management.
You must have Monitor selected in the Shared tab of your Workflow Management security role to create a monitor for workflow processes. You must have Monitor selected in the Options tab of your SLM security role to create a monitor for SLM.
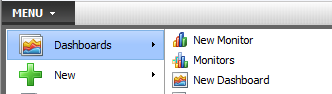
- Select
 and then Dashboards.
 - From the submenu, select New Monitor
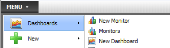 .
. - Step 1 of the Monitor Wizard is displayed. Work your way through the steps described below.
Defining the Name, Type and Style of Monitor
-
 Display the Step 1: Monitor Wizard Analysis Definitions window if it is not already on screen
  :
:
Select
, Dashboards and New Monitor. To update an existing monitor, select Monitors and select an existing monitor. Then select
 to view the monitor in update mode.
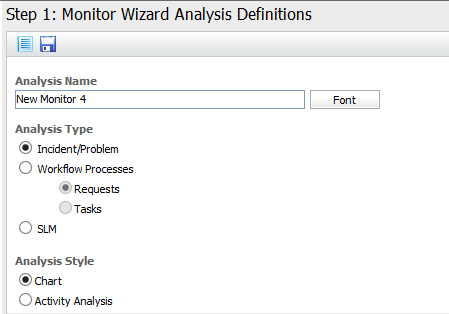
- Complete the details:
Incident/Problem
Workflow Processes (Requests)
Workflow Processes (Tasks)
SLM to monitor Service Level Management agreements (SLAs, OLAs and UCs), breaches, escalations, and so on
- Chart– a visual report on past events, such as a rundown on how many calls of a certain issue type were resolved in the last week
- Activity Analysis – a real time representation of events occurring in the system at the current time, such as a visual display of which calls are currently about to trigger an escalation
- Select
 to proceed to the next step of the wizard, or
  to close the wizard and save the changes.
| Analysis Name | The name of the monitor. It is a good idea to give the monitor a meaningful name that describes its function, such as “Current day service level escalations”. |
| Analysis Type | Select the entity type to be monitored: If any of these options are grayed out, check your security role settings, as outlined in the prerequisites. |
| Analysis Style | Select how the information is to be displayed: |
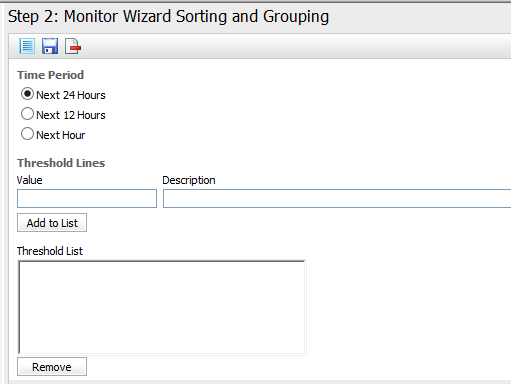
Defining Sorting and Grouping for Monitors
-
Display the Step 2: Monitor Wizard Sorting and Grouping window if it is not already on screen:
Select
, Dashboards and New Monitor. To update an existing monitor, select Monitors and select an existing monitor. Then select
to view the monitor in update mode. Use the wizard or select Sorting and Grouping from the explorer pane. - Set the sorting and grouping options. These will differ depending on whether you chose Chart or Activity Analysis as your analysis style in the Analysis Definitions window.
-
Set sorting and grouping for an activity analysis:

Time Period Specify whether the analysis will pick up and show data for the Next 24 Hours, Next 12 Hours or Next Hour. Threshold Lines Specify lines to place on the activity analysis to indicate significance.
Value The point at which you want a threshold established Description The description of the threshold If, say, five calls with severe priority at any one time represents a critical situation, you can create a threshold line with a value of 5 and give it the name “Critical”. A line indicating this threshold point will appear on the activity analysis.
You can compare the evolving graphs to the threshold in real time. Threshold lines are useful for reference purposes, and can be used to gauge the status of certain KPIs (Key Performance Indicators). Key a number into the Value field, a name into the Description field and select Add to List. The threshold will be added to the analysis.
To remove a threshold, select it from the Threshold List text box and select
 .
. - Select to proceed to the next step of the wizard, or to close the wizard and save the changes.
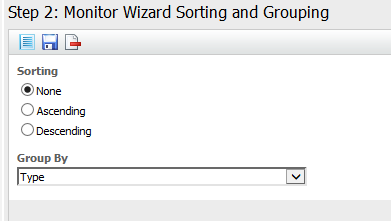
| Sorting | To display the results sorted in Ascending order, Descending order, or unsorted (None) |
| Sort Axis | Select whether you want the data sorted along the X axis (horizontal) or Y axis (vertical) |
| Group By | Choose how you wish to group the results from the drop down list of criteria. The options displayed depend on whether your chart involves calls, requests, tasks or agreements. If you select Call Logged Date, a selection of date grouping options are displayed from which you can select the grouping you want. If you choose Week, weekly statistics start on the Sunday by default. You can alter this in System Settings using the Week Starts On option. |
| Drilldown Group By | Select a second level of grouping
based on the values in the Group By field. When viewing the monitor, you can then drill down to a further graph to view items of the selected values, grouped by the selected Drill-down group. |
| Activities |
This is only available if you are creating a chart for SLM. Select the activity or event you want to use to filter the chart. If you do not want to filter by SLM event, select Unspecified, or deselect the checkbox. |
Setting Other Monitor Options
-
Display the Step 3: Monitor Wizard Other window if it is not already on screen:

Select
, Dashboards and New Monitor.To update an existing monitor, select Monitors and select an existing monitor. Then select
to view the monitor in update mode.Use the wizard or select Other from the explorer pane.
- Specify the required settings:
- Select to proceed to the next step of the wizard, or to close the wizard and save the changes.
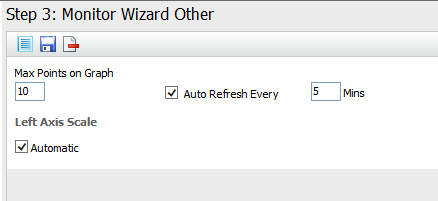
| Max Points on Graph | The maximum number of results (or points, columns, and so on, depending on your graph style) to be displayed per page. |
| Auto Refresh | The frequency, in minutes, at which the monitor will be refreshed automatically to display an updated monitor. The minimum value is 5. There is no maximum value. If you deselect the option, you will have to manually refresh the monitor when viewing it to see the latest information. |
| Left Axis Scale | The number range for your monitor. Automatic is selected by default, and this allows the system to generate the scale automatically. This is usually the best option. To specify your own scale, deselect the Automatic option. Then deselect either or both of the Auto options that are displayed and specify a Maximum and Minimum. |
| View 3D |
You can also specify further options when viewing a monitor.
Setting Filter Options for Monitors
You can limit the number of results plotted on your monitor based on specified filters.
-
Display the Step 4: Monitor Wizard Filter window if it is not already on screen:
Select
, Dashboards and Monitors to select a monitor.Select
to view the monitor in update mode.Use the wizard or the explorer to the left of the window to display the window.
- Select from the displayed filter options. These will differ depending on the selection you made at Analysis Type.
- If your system is partitioned, select the Partition you want to include. The default value is Unspecified, which will include all partitions.
- You can also select the Include Deleted Field Values option, to include values that have been deleted for the selected fields. For example, if you are filtering on Submitted items and include deleted fields, the monitor will show those submitted items that have been deleted.
- To add further criteria, select
 in the toolbar and follow the instructions to configure monitor search criteria.
 - Select to proceed to the next step of the wizard, or to close the wizard and save the changes.
You may also see an  text link, depending on the settings in your security role. You can use this to apply more advanced monitor filters.
Applying Advanced Monitor Filters
Alemba Professional Services can assist you in creating custom monitors to suit the needs of your organization. Please contact your Account Manager for more information.
Before you start
To display the Advanced Search option when creating a monitor displaying data relating to calls, you must have Call Advanced Search selected in the Options tab of your IPK Management security role.
To display the Advanced Search option when creating a monitor displaying data relating to requests, Request Advanced Search in the Requests tab of your Workflow Management security role.
To display the Advanced Search option when creating a monitor displaying data relating to tasks, Task Advanced Search in the Tasks tab of your Workflow Management security role.
-
Display the Step 4: Monitor Wizard Filter window if it is not already on screen:
Select
, Dashboards and Monitors to select a monitor. Select to view the monitor in update mode.Use the wizard or select Filter from the explorer pane.
- Select the
 text link to display the Advanced Search Criteria window.
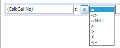
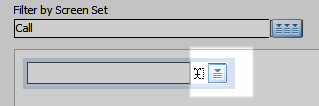
 - The Filter by Screen Set field is already completed, based on the choices made at the Analysis step. Click on the question mark at the top of the text box to see a blank field, with a drop down search button beside it
 . The details contained will depend on the screen set.
 - Click on the search button and select the first filter, scrolling down if necessary.
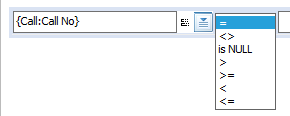
- Double click on it to see it appear at the top of the text box, with a drop down box to its right, in which you can select the function for the next filter
 . Select the function and then, using the next box, select the next item by which to filter.
 - Continue in this way until you have created the advanced search filter, and then select Ok to return to the Filter window.
- Select the checkbox to allow the advanced search to be used by the monitor.
Configuring Additional Monitor Filters
You can create additional monitor filters if the standard options do not satisfy your requirements. You can add sections and fields, and move them up and down the list.
-
Display the Step 4: Monitor Wizard Filter window if it is not already on screen:
Select
, Dashboards and Monitors to select a monitor and select to view the monitor in update mode.Use the wizard or the explorer to the left of the window to display the window.
- Set the standard monitor filter options.
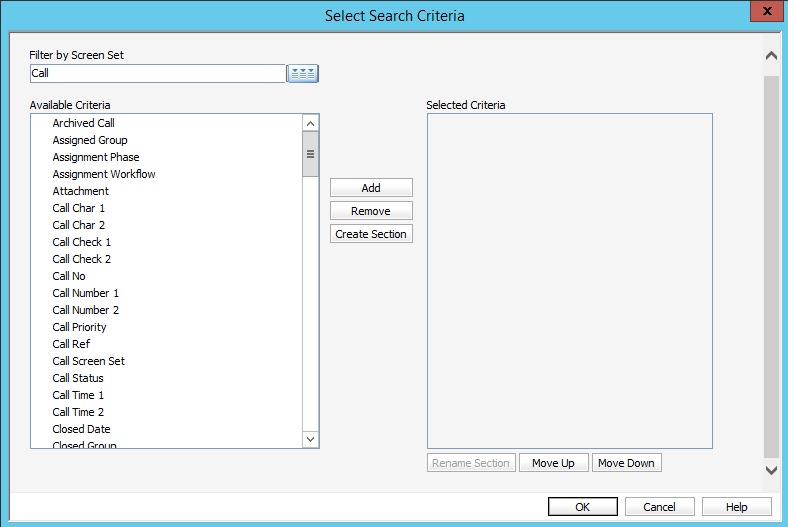
- Select to configure the search criteria. The Select Search Criteria window is displayed with the Filter by Screen Set option automatically set depending on whether your monitor involves calls, requests, tasks, or agreement data. The available fields will include standard data fields and custom fields added through the Designer
 .
. - Create/configure the sections and fields, noting the following:
- When setting filter criteria for an Incident/Problem or Workflow monitor, This Week refers to the current week from Monday to Sunday, including the weekend, unless it has been modified in the System Settings.
- When setting filter criteria for Service Level Management monitors, Organization will filter based on the organization defined in the contact information option for the agreement, not any organizations that are linked to the agreement as selection criteria.
- Target Date filter to None will show all SLA events logged in the system (based on the Activities selected on the Sorting and Grouping window), regardless of how close they may be to reaching escalation or breach thresholds.
- Select OK to save the new filter options, or Cancel to return to the previous screen without saving the changes. When you save the options, the Monitor Wizard Filter window is displayed once more, showing your new sections and fields.
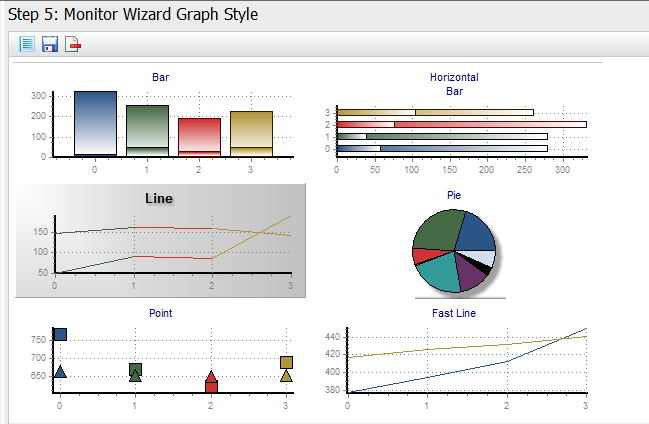
Selecting a Graph Style for your Monitor
You can choose a visual style for your chart or activity analysis.
-
Display the Step 5: Monitor Wizard Graph Style window if it is not already on screen:
Select
, Dashboards and Monitors to select a monitor and select Monitors and select an existing monitor. Then select to view the monitor in update mode.Use the wizard or select Graph Style from the explorer pane.
- The styles available will depend on the options you have chosen for your monitor in Step 1. Sample representations are shown for each of the styles
 .
. - Select the style you would like to use.
- Select . The monitor displays in the current window.
You can also specify further options when viewing a monitor.
Updating your Monitor Settings
You can revisit and update the defined settings once the monitor has been created.
-
Display the monitor, if it is not already on screen.
- Select and then Dashboards.
- From the submenu, select Monitors to display a list of your monitors.
- Select the monitor you want to view to see it displayed in a window.
If your monitor appears in a dashboard, it may be displayed automatically, or can be viewed by opening the dashboard.
- Select
- Select .
- The first window of the monitor wizard is displayed. Make any necessary changes on this window or select one of the others by selecting or using the options on the Explorer pane.
You can also add further chart options.
Specifying Chart Options on Existing Monitors
You can update and add further chart options when viewing a monitor.
-
Display the monitor, if it is not already on screen.
- Select and then Dashboards.
- From the submenu, select Monitors to display a list of your monitors.
- Select the monitor you want to view to see it displayed in a window.
If your monitor appears in a dashboard, it may be displayed automatically, or can be viewed by opening the dashboard.
- Select
- Select the
 button on the toolbar . The Graph Options window is displayed. The options shown depend on whether the monitor is a chart or an activity analysis.
 - If you are working with an Activity Analysis, you can change the Series Type to select the type of graph you want to use.
- If you are working with a graph, you can change the following settings:
Group by A drop down field that allows you to group the data in different ways. The options available in this field are set by Summary calculation A drop down list that allows you to generate and display different summary calculations on your monitor Max points per page The maximum number of points that can be displayed on the page. This is not displayed if a pie chart is selected.
Minimum pie value The smallest value that will create a "slice" in the pie. This is only displayed for pie charts.
Refresh interval How often the data will be refreshed, in minutes Sort The order in which the data is displayed on the graph - You can also update or set further options using:
- To view your changes before saving them, select the Preview tab at the top of the window
 .
. - Select
 to save them,
  to return to your previously chosen settings, or
  to return to system defined settings.
| Advanced | Advanced graph options |
| Export Settings | Save graph settings defined in the Advanced option as a graph file. A window is displayed prompting you for a name and location for the file. |
| Import Settings | Apply custom graph settings to the monitor. A window is displayed prompting you for a name and location for the file. |
Setting Advanced Graph Options
You can update and add chart options when viewing a monitor. The standard settings are available in the Graph Options window, but to alter more advanced settings, such as data displayed, design, text formatting, axis attributes, data points displayed, labels and print orientation and mapping, you need to use the Advanced option.
-
Display the monitor, if it is not already on screen.
- Select and then Dashboards.
- From the submenu, select Monitors to display a list of your monitors.
- Select the monitor you want to view to see it displayed in a window.
If your monitor appears in a dashboard, it may be displayed automatically, or can be viewed by opening the dashboard.
- Select
- Select
 . The Graph Options window is displayed. The options shown depend on whether the monitor is a chart or an activity analysis.
 - Select the
 button towards the bottom of the window. The Editing ChartOnPage window is displayed.
 - Select the aspect of the chart you wish to alter from the left pane to see details and settings in the main part of the window. You may need to expand the Series and Chart options. You can choose from the following options:
- Save the settings by selecting
 or in the relevant tab. If no save option is shown, the updates are saved automatically.
 - Select
 to save your updates and return to the Graph Options window.
 - Select to save the updates, to return to your previously chosen settings, or to return to system defined settings. Select to close the dialog box, if it has not already closed.
| Select | To set... |
|---|---|
| Series | the title of the selected data series. Select the series and then Title in the right panel of the dialog box |
| Data | format, points, gradient, marks and other settings (the list will reflect the data series set) |
| General | zoom, scroll, cursor and font settings |
| Axis | scales, titles, labels, ticks, grid and position |
| Titles | style, position, format, border, text, gradient, shadow and picture |
| Legend | style, position, symbols, title, format, border, text, gradient, shadow and picture |
| Panel | color, borders, margins, gradient, shadow and image |
| Paging | points per page, legend, scale, page number, auto scale axis |
| Walls | color, border, pattern and gradient |
| 3D | options and views |
| Tools | further chart tools to enhance the appearance of the chart |
| Animations | to animate aspects of your chart |
| Export | picture formats and options, native and data exports |
| orientation, setup, default printer | |
| Themes | choice of available themes |
The functionality within this window is provided by Teechart. To find out more about how to update the settings in this window, go to www.teechart.net/reference.
Printing the Contents of your Monitor
-
Display the monitor, if it is not already on screen.
- Select and then Dashboards.
- From the submenu, select Monitors to display a list of your monitors.
- Select the monitor you want to view to see it displayed in a window.
If your monitor appears in a dashboard, it may be displayed automatically, or can be viewed by opening the dashboard.
- Select
- Select the
 button on the toolbar.
 - In the dialog box, select the printer and specify the orientation, margins, etc. before selecting Print.
Copying a Graph in your Monitor
You can copy the graph displayed on the monitor into the clipboard, to use in applications outside vFire Core.
-
Display the monitor, if it is not already on screen.
- Select and then Dashboards.
- From the submenu, select Monitors to display a list of your monitors.
- Select the monitor you want to view to see it displayed in a window.
If your monitor appears in a dashboard, it may be displayed automatically, or can be viewed by opening the dashboard.
- Select
- Select the
 button on the toolbar. Nothing appears to have happened but the graph is now copied into the clipboard memory as a bitmap (image) file.
 - Open the application in which you wish to use the image, and paste the file in the normal way.
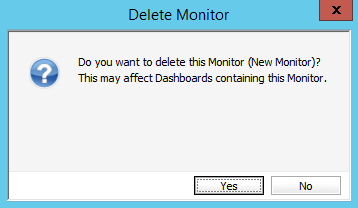
Deleting a Monitor
You can delete monitors you no longer need or use.
This is not the same as closing the monitor. The monitor will actually be deleted from the system and you will have to rebuild it. If you just want to close the window, use the  button at the top of the window.
-
Select , Dashboards and Monitors to select a monitor
- Use the wizard or the explorer to the left of the window to display the window.
- Select
 on the toolbar. A warning message displays asking you to confirm the deletion.
- Select
 to delete or
  to quit without deleting the monitor.